WKO

COACH'S WKO5 DASHBOARDS


WKO5 is the analytical software used by CPT Cycle Coaching to track athlete progress through additional and modelled metrics and to plan individualised targets. If you use WKO5 charts to monitor your own progress and want to use the chart dashboards created by WKO5 future works tester; coach Richard Rollinson; these can be downloaded below for free. All WKO5 charts contain a description on how and what to use them for. Cycling data analysis progresses and evolves, so these files are updated on an ongoing basis. You can also get updates on charts in the CPT Cycle Coaching Newsletter
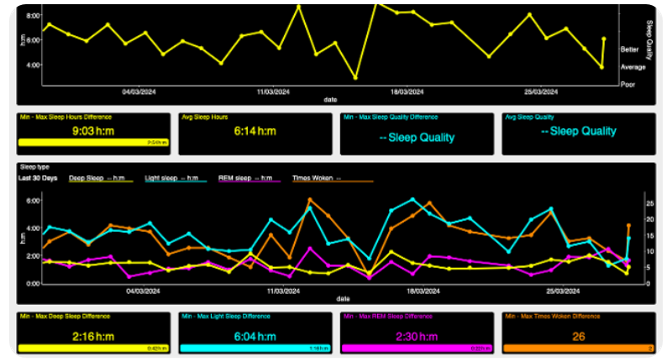
 

Recovery

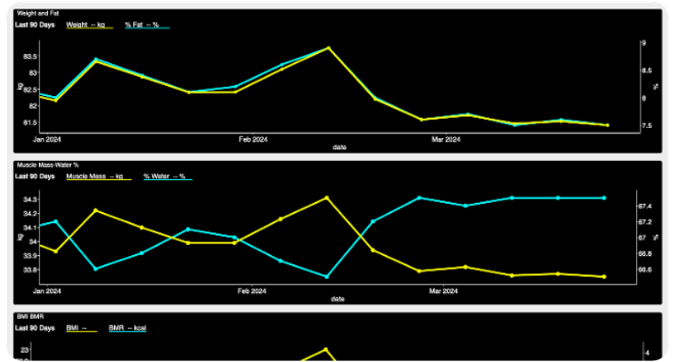
Tracks athlete feeling through scores and notes as well as health metrics from wearable sensors. Updated with min-avg-max gauge charts

Load

Includes TSS, duration and KJ charts to compare completed and planned training, with daily and weekly values. Updated with guage averages

PMC

Contains PMC with CTL, ATL, CIL, heat mapped TSB, 7day mFTP and CTL ramp rate. Updated to include min - avg - max gauge charts

PD Bests

Displays PDC, MMP and NP highlighting 90 day and season peak power bests. Power @ KJ can be used to identify fatigue resistance

Peaks

Displays daily peaks for 3 sprint, FRC, Vo2max, FTP and Stamina durations. Updated to compare average top 5 peaks to 90 day best with gauge charts

Hero bar

A display of historical Pmax, FRC, Vo2max with mFTP % of Vo2max, sFTP, 90 and 30 days mFTP, TTE and Stamina from RHE date range

Heart rate

Use to compare progress of aerobic fitness to power and identify max and threshold heart rate. Updated with DFA/ respiration rate chart

Muscle O2

Insights into total hemoglobin (Thb) and trends of min, avg and max muscle oxygen (Smo2). Updated to show daily distribution of Hex zones

Intensity

A collection of WKO5 charts to measure power intensity. Updated to show IF gauge charts, Training impact score and daily time in iLevels

Summary

Displays a selection of WKO5 charts with workout average values including average power, speed, temp and climbing. Updated to show distance

Cadence

Use to compare cadence and power at difference intensities. Updated to show average and max cadence gauge charts

Targets

Use to track iLevel progress and to set test and sub max intervals from completed PDC. Updated to show new target PDC durations

Phenotype

Tracks athlete Phenotype, historical estimated muscle fibre type and contribution of different physiology to Power duration curve

Power profile

Use this Dashboard to monitor strengths and limiters and to compare W/Kg power to other riders

Cycling dynamics

A collection of WKO5 charts from Garmin Vector Cycling and MTB Dynamics; tracking power phase, PCO, grit and flow scores at athlete level

Torque effectiveness

A selection of dual sided power meter WKO5 charts to analyse and action economy and effectiveness of pedalling

Weight

A range of metrics that make up and relate to weight including percentage body fat, water, muscle mass and BMI

Workout

Tracks new power bests, rolling metrics to highlight intervals with power, HR zones and muscle oxygen. Updated to show DFA Alpha 1

Single intervals

Zooms to compare power heat map with gears. Power and HR zone distribution. Updated with gauge charts for interval averages and trends

Multi intervals

Contains crank speed crossed with torque quadrant analysis scatter plot and cadence distribution

cptcyclecoaching@gmail.com

Privacy Policy0

©2024 CPT Cycle Coaching